Nexa Workforce Analytics
A 3-page Excel HR report that showed an ageing workforce, middling engagement and a $1.59M training budget that wasn't paying off.
Slicers, pivot-driven charts and KPI cards all update together. Open the file and click the slicers to explore it yourself.
 Full size ↗
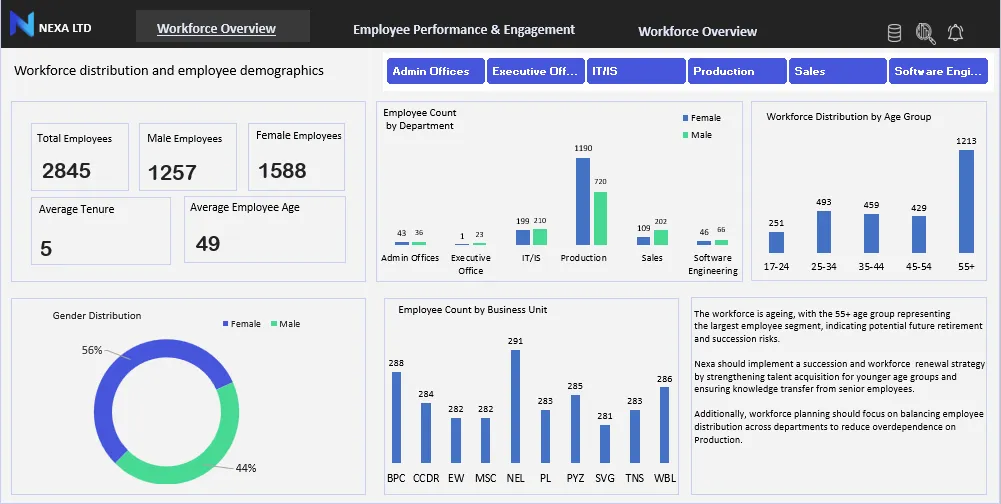
Workforce overview. Headcount, gender, tenure, age groups and how employees spread across departments and business units.
 Full size ↗
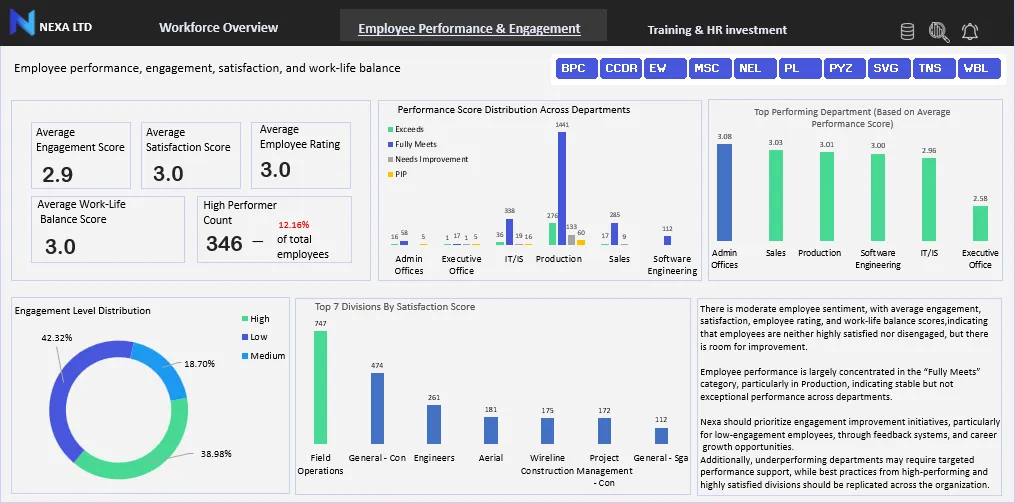
Performance & engagement. Engagement, satisfaction, work-life balance and ratings, high performers and the top divisions by satisfaction.
 Full size ↗
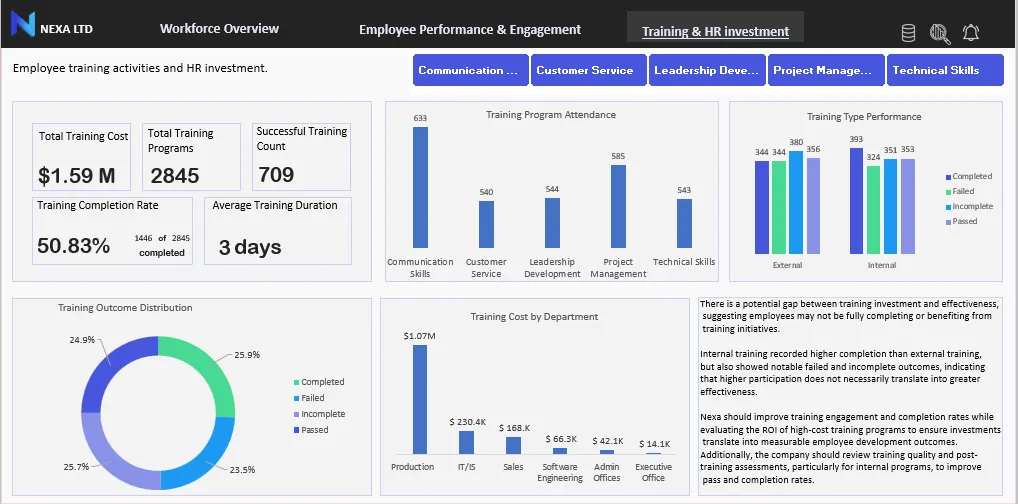
Training & HR investment. Training cost by department, attendance, completion and outcomes, and internal vs external programmes.
Workforce, engagement & training ROI
Nexa Ltd's leadership needed one view of key HR metrics to plan for engagement, performance management, workforce planning and training effectiveness.
I turned raw employee, department, performance, engagement-survey and training data into a three-page interactive Excel dashboard covering the workforce overview, performance and engagement, and training and HR investment. It has slicers for departments, business units and training programmes.
What the data said.
What to do next, with targets.
Each recommendation has a KPI, so the team can measure whether it worked.
A single, interactive view of workforce health, engagement, training effectiveness and talent risk for Nexa's HR and leadership teams.
Datasets provided as part of a workforce analytics case study coordinated by Victory Nnajekwu. All cleaning, analysis and visuals were done independently by Dorcas.
=IF(you_have_data, "let's look at it together", "say hello anyway")
Whether it's a role, a messy spreadsheet or a question about one of the case studies, messages come straight to my inbox.
Open to data analyst and BI work: full-time, contract or freelance, remote or on-site