HeartSync Product Analytics
A 5-page Power BI product report for a global dating app, following the user journey from sign-up to match, subscription and safety reports.
Don't just look at it. Click through it.
This is the real, published Power BI report. Use the slicers, change pages and click any visual to cross-filter the rest, the same way a manager would use it.
Real Power BI reports, published from my workspace. Nothing here is a mock-up: filter, drill and cross-highlight like a stakeholder would.
Page by page · screenshots
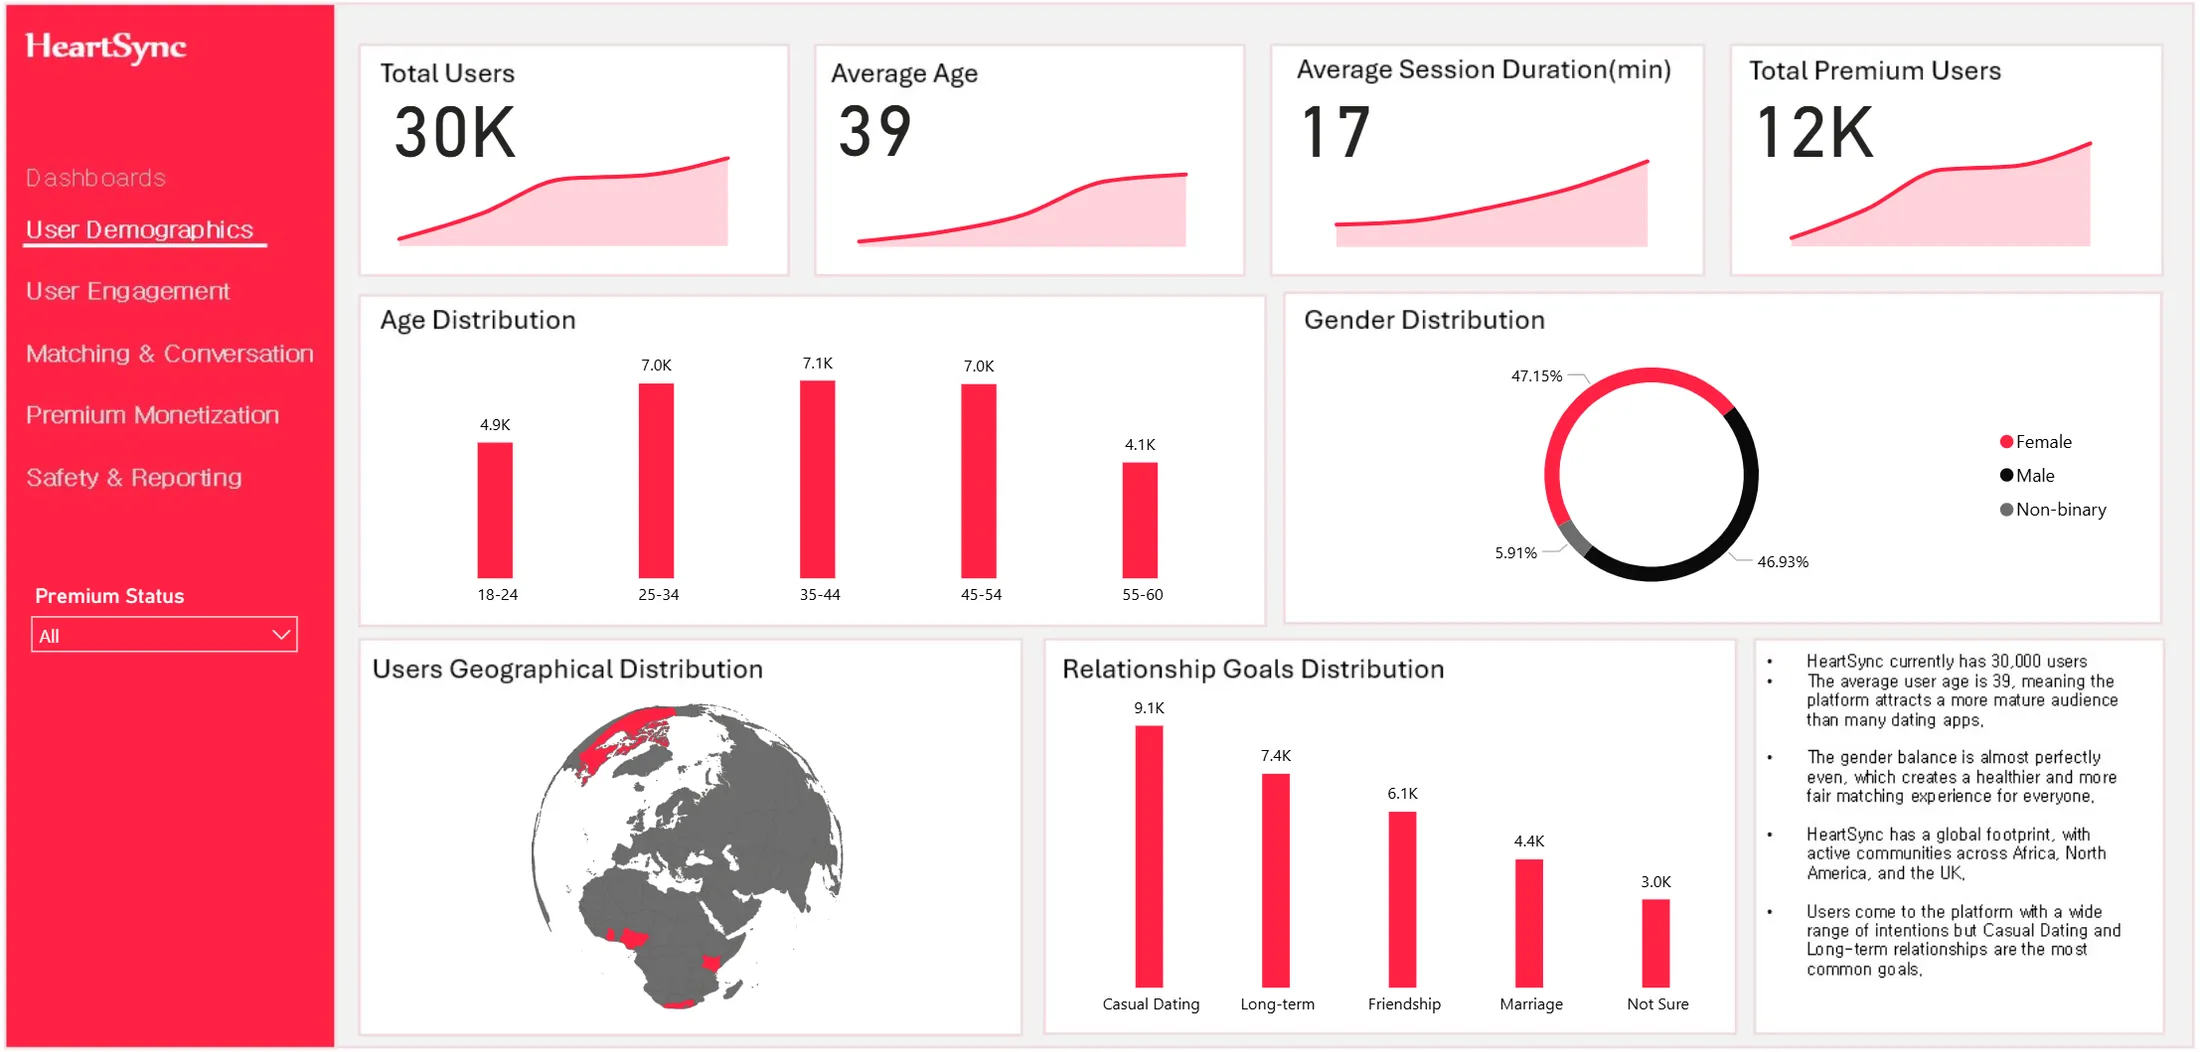 Full size ↗
Demographics. Who is on the app: age, gender, geography and relationship goals.
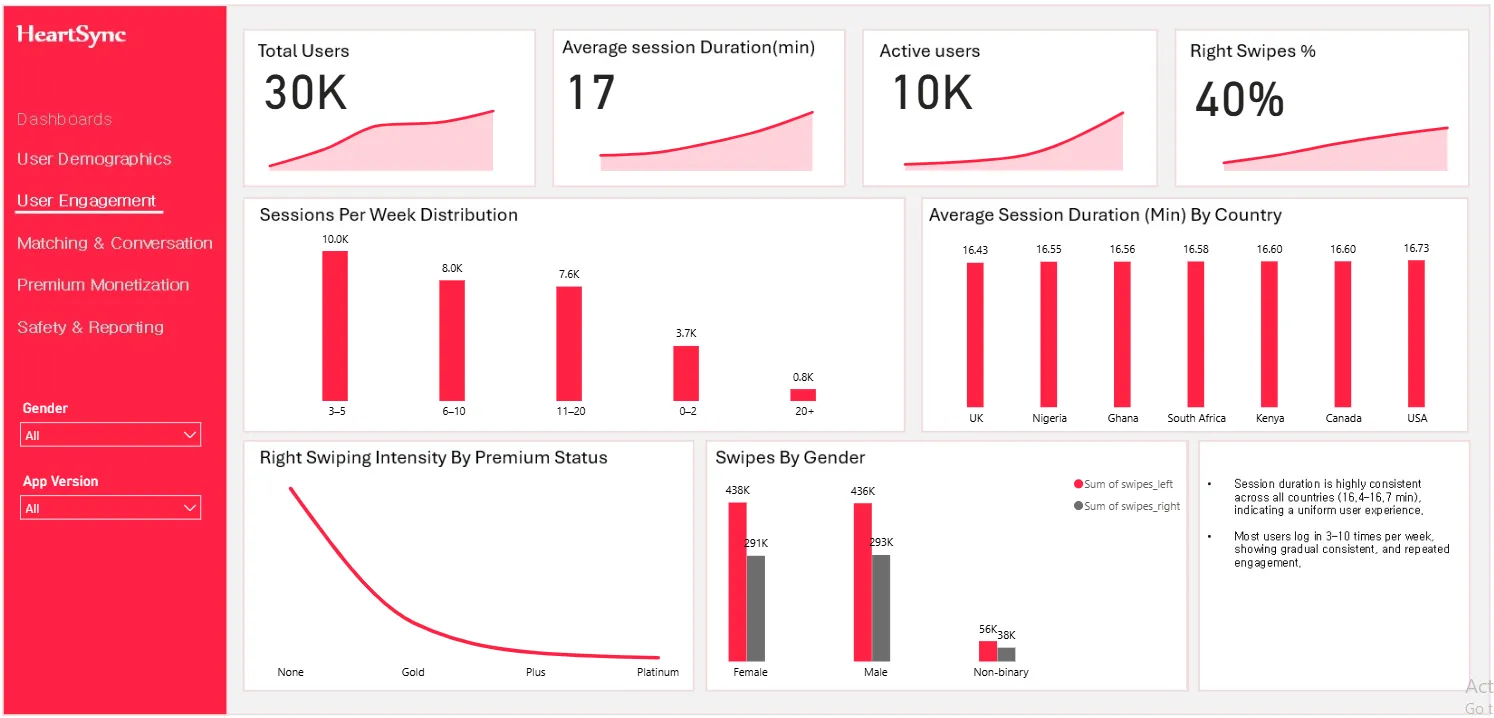 Full size ↗
Engagement. Sessions per week, session length by country, right-swipe rate and swipe intensity by premium status.
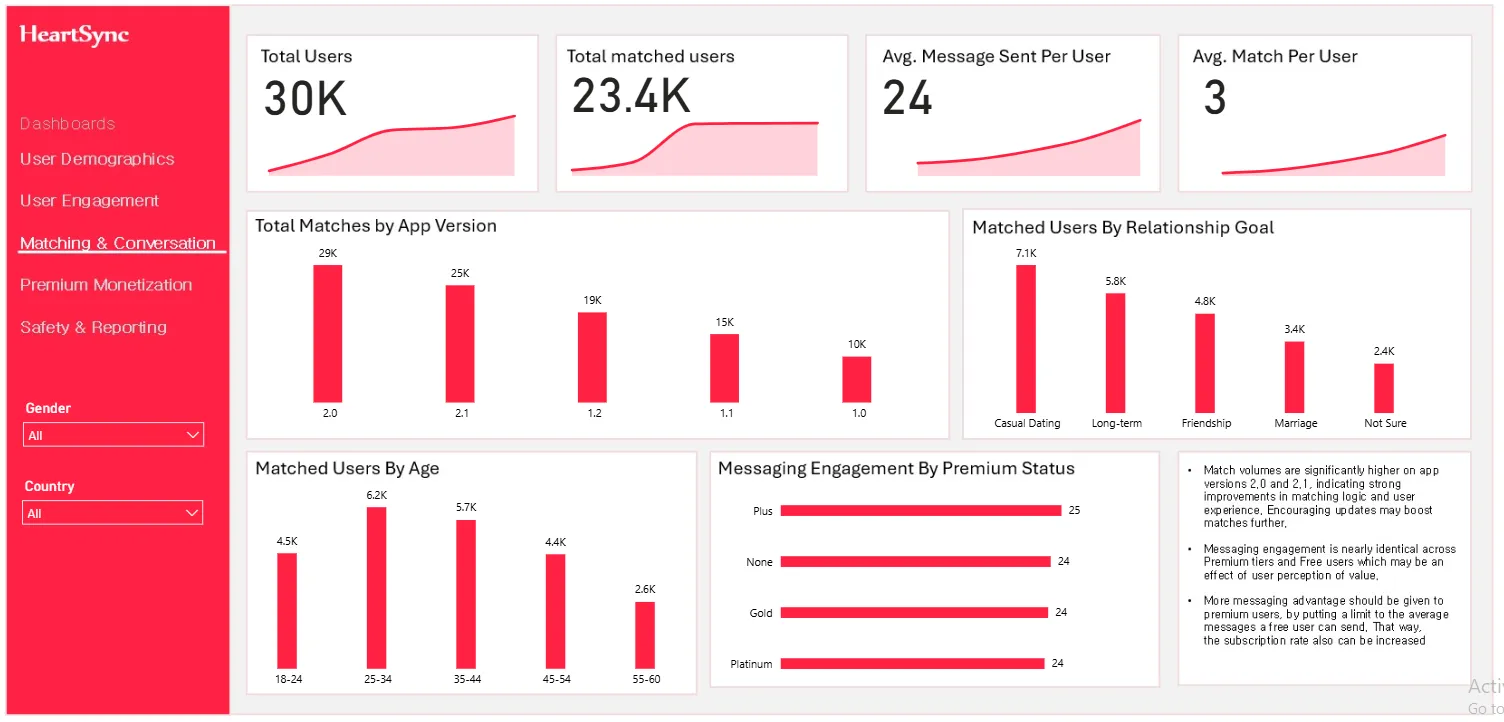 Full size ↗
Matching. 23.4K matched users. Matches by app version, relationship goal and age, and messaging by tier.
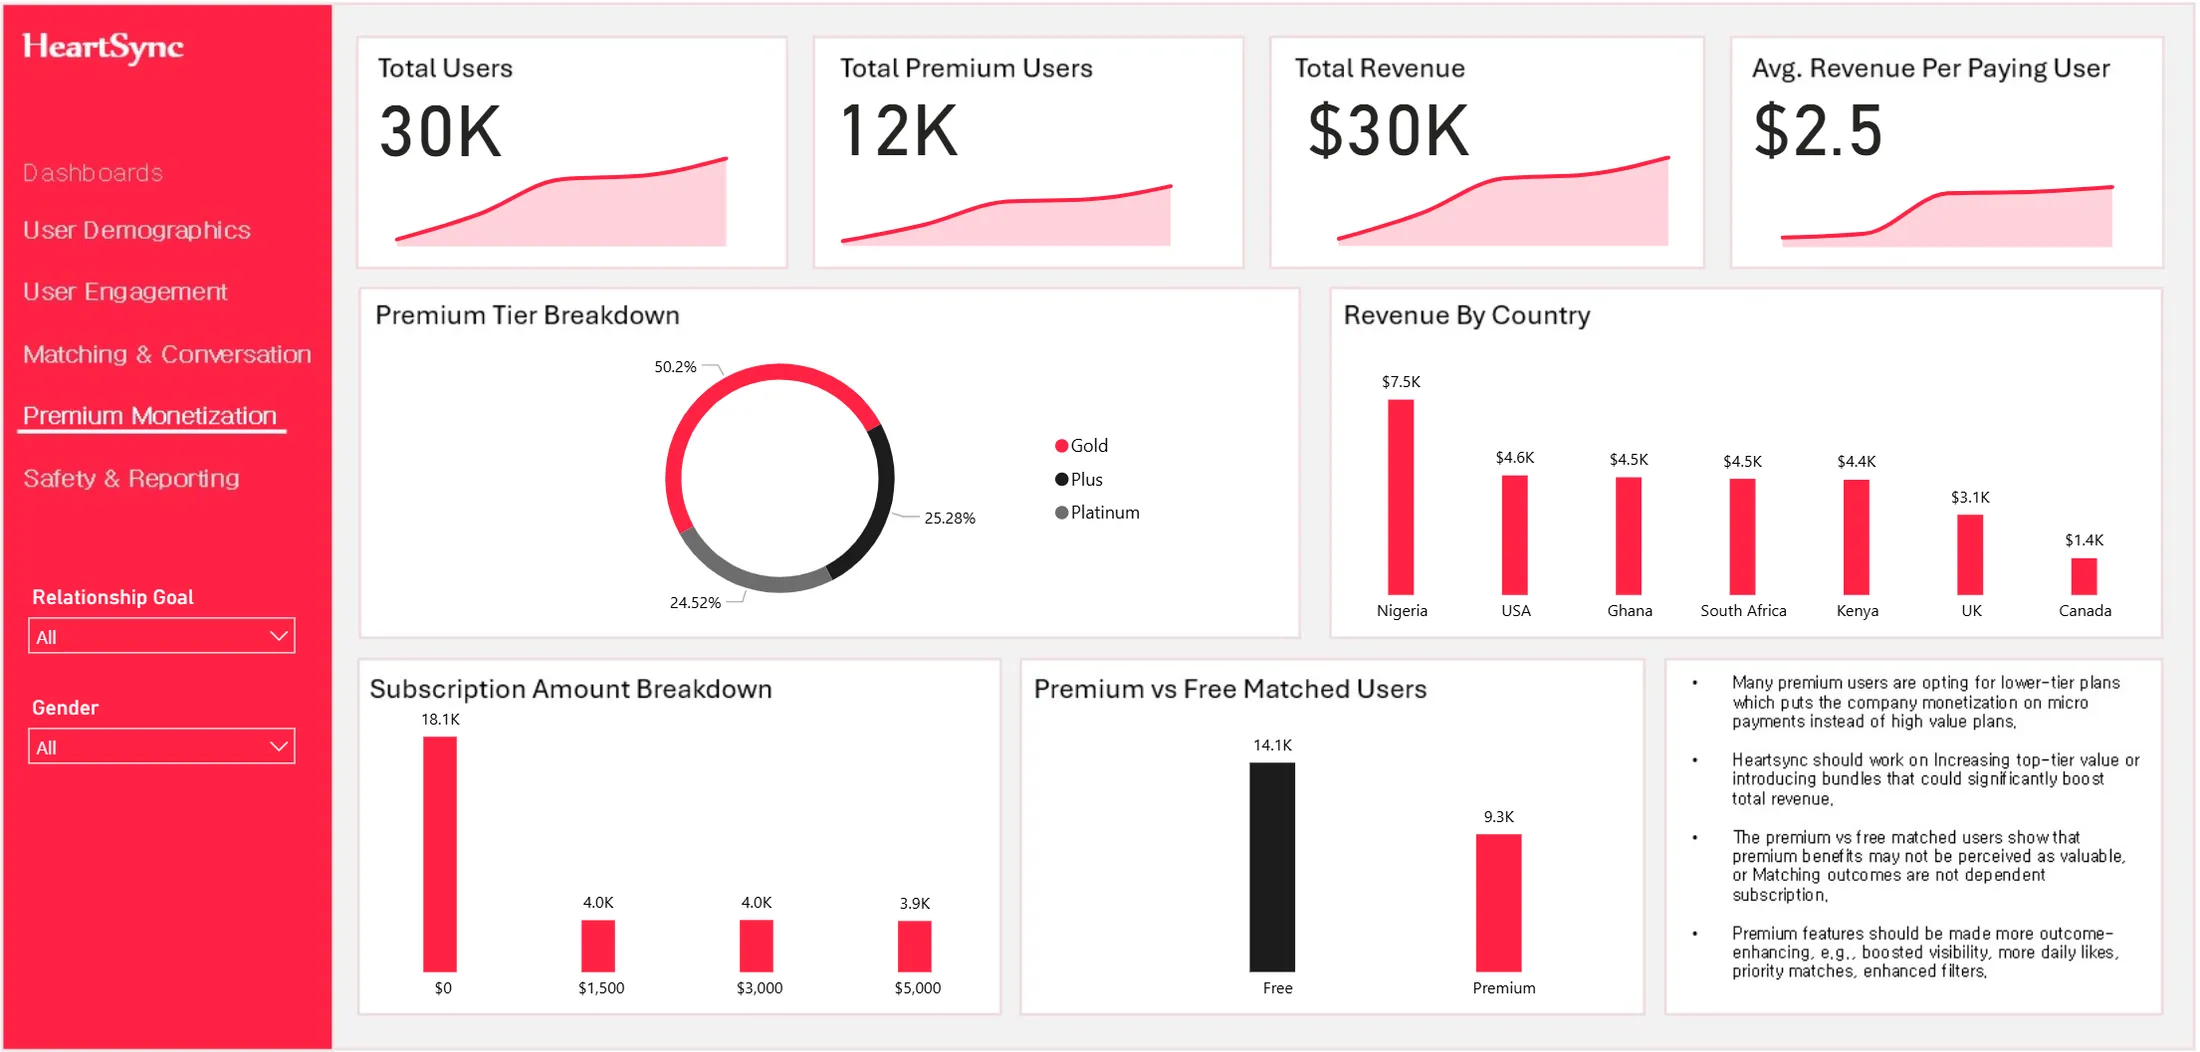 Full size ↗
Premium. Tier breakdown, revenue by country, subscription amounts and premium vs free outcomes.
 Full size ↗
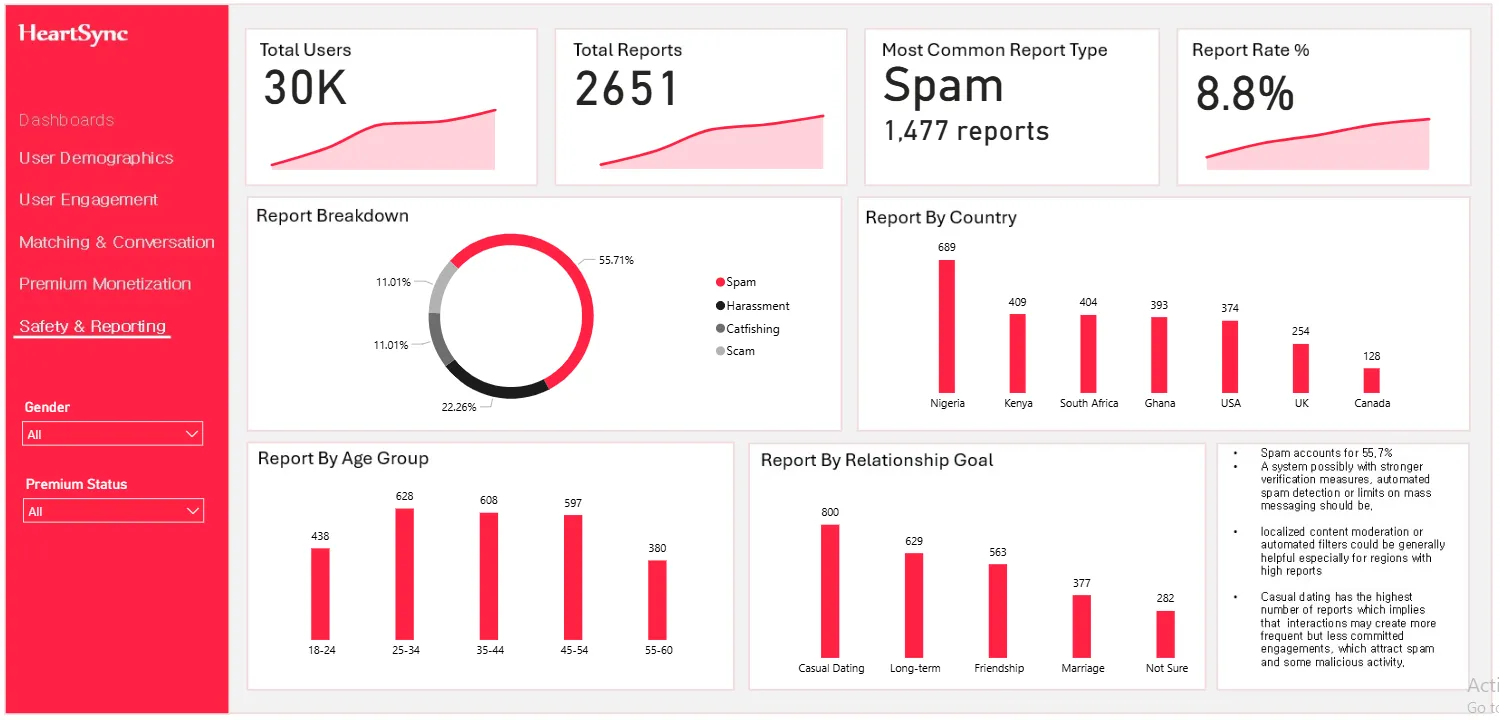
Safety. 2,651 reports. Report types, hotspots by country, and reporting by age group and goal.
User engagement, monetisation & safety
HeartSync is a global dating platform. Its product team needed one view of how people use the app: who joins, how they engage, what drives a successful match, who pays for premium and where safety risks sit.
I built a five-page Power BI suite that follows the user journey: demographics, engagement, matching and conversation, premium monetisation, and safety and reporting. Each page has slicers for age group, gender, app version, premium status and country, with DAX measures for match rates, engagement and conversion.
What the data said.
What to do next.
A full analytics view for HeartSync's product team covering demographics, engagement, matching, monetisation and trust & safety, so product and policy decisions start from data.
A realistic simulated dataset of user profiles, swipes, sessions, matches, messages, subscriptions and safety reports. All analysis and visuals by Dorcas.
=IF(you_have_data, "let's look at it together", "say hello anyway")
Whether it's a role, a messy spreadsheet or a question about one of the case studies, messages come straight to my inbox.
Open to data analyst and BI work: full-time, contract or freelance, remote or on-site