Maven Electronics Sales Performance
A 4-page Power BI report for a global electronics retailer: what sells, who buys, which stores carry the business and where revenue is slipping.
Don't just look at it. Click through it.
This is the real, published Power BI report. Use the slicers, change pages and click any visual to cross-filter the rest, the same way a manager would use it.
Real Power BI reports, published from my workspace. Nothing here is a mock-up: filter, drill and cross-highlight like a stakeholder would.
Page by page · screenshots
 Full size ↗
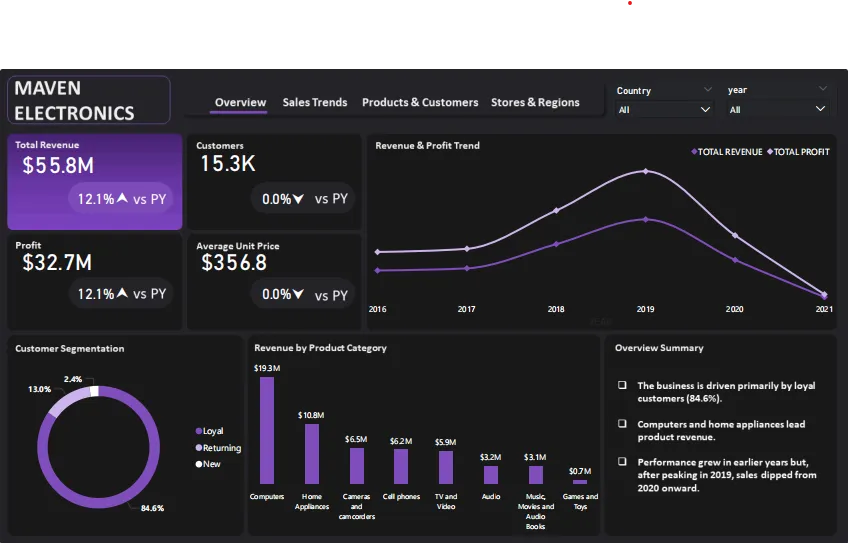
Overview. Executive overview: revenue, profit, customers and unit price against the prior year, the revenue and profit trend, segments and categories.
 Full size ↗
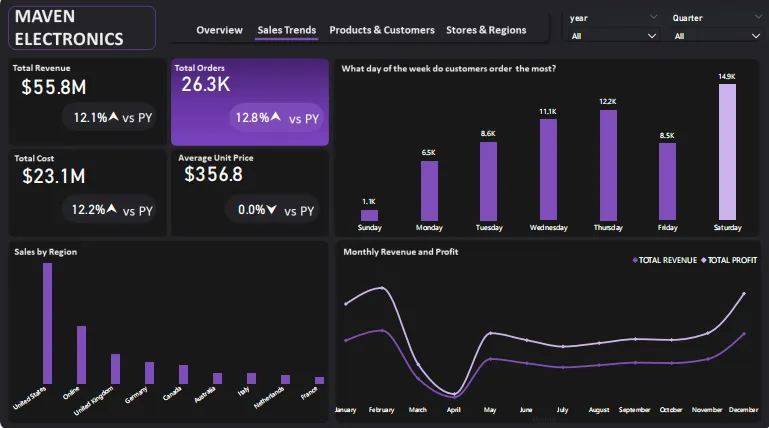
Sales trends. Which days and months customers order on, revenue by region and the monthly revenue-to-profit picture.
 Full size ↗
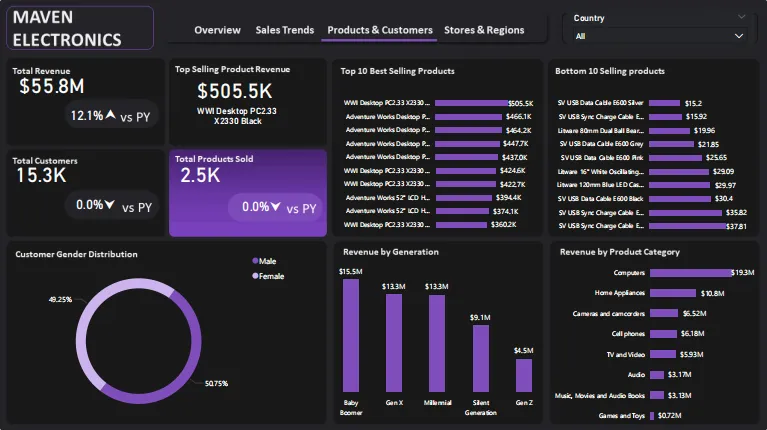
Products & customers. Top and bottom 10 products, revenue by generation and category, and the gender split of buyers.
 Full size ↗
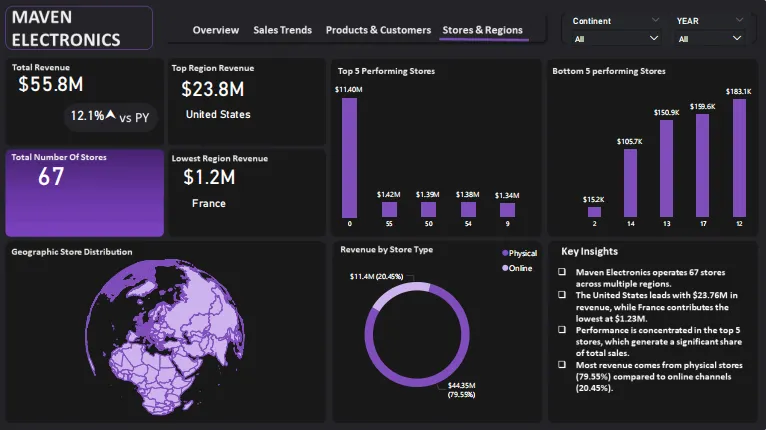
Stores & regions. Top and bottom five stores, the best and weakest regions, the global store map and physical vs online revenue.
Sales, customers & store performance
Maven Electronics is a multinational electronics retailer with several years of transaction data across products, customers, regions, sales channels and stores.
The goal was to find patterns in revenue, spot high-performing products and regions, understand customer demographics and compare store performance. I modelled five raw tables (sales, customers, stores, products and exchange rates) into a star schema and built a four-page Power BI report with page navigation, DAX time intelligence and drill-through.
What the data said.
What to do next.
A complete, interactive Power BI report that helps Maven Electronics understand revenue drivers, track product performance, compare stores and regions, and back strategic decisions with data.
Datasets provided by Tina Okonkwo as a practical assignment in a Power BI cohort. All cleaning, modelling and visuals were done independently by Dorcas.
=IF(you_have_data, "let's look at it together", "say hello anyway")
Whether it's a role, a messy spreadsheet or a question about one of the case studies, messages come straight to my inbox.
Open to data analyst and BI work: full-time, contract or freelance, remote or on-site