MetroBank Customer Insights
A 5-page Excel intelligence report on who MetroBank serves, where its money moves, which branches lose money and why customers complain.
Slicers, pivot-driven charts and KPI cards all update together. Open the file and click the slicers to explore it yourself.
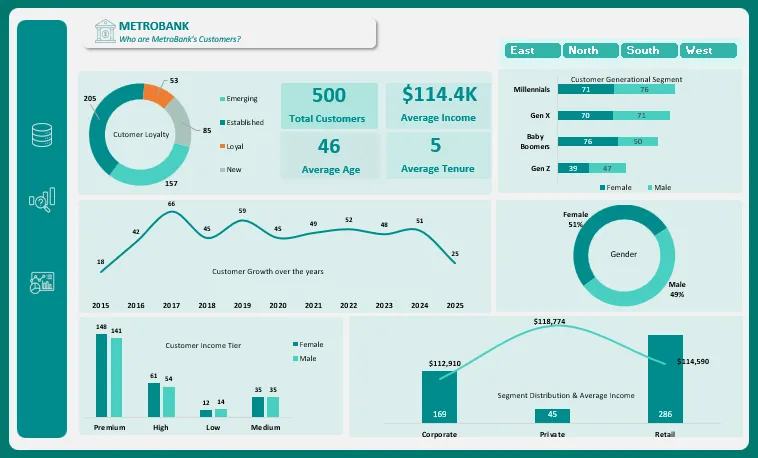 Full size ↗
Customers. Who are MetroBank's customers? Loyalty, income tiers, generations, gender and segment value, sliced by region.
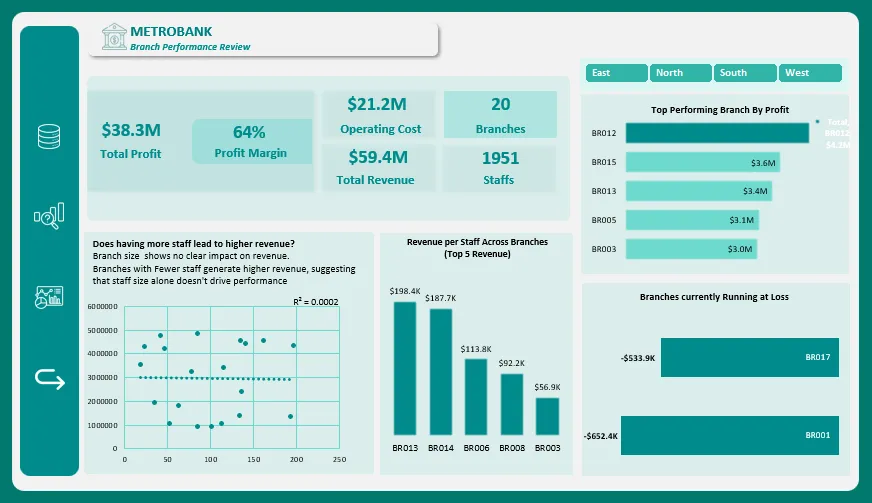 Full size ↗
Branches. Branch performance review: revenue, profit margin and revenue per staff, plus the two branches currently running at a loss.
Customer insights & banking performance
MetroBank was facing tougher competition and a rising pile of customer complaints. Management wanted to understand what drives performance across customer segments and branches, and which areas needed attention first.
I cleaned five raw datasets (customers, accounts, transactions, branches, and complaints & fraud reports), modelled them in Power Query and built an interactive Excel dashboard. It tells the full story of the bank's operations and customer experience, from customer profiling to fraud exposure.
What the data said.
What to do next, with targets.
Each recommendation has a KPI, so the team can measure whether it worked.
An end-to-end interactive Excel report, from raw data to recommendations, that gives MetroBank's leadership one place to see customers, products, channels, branches and service quality.
Datasets provided by Freedom Oboh as a practical assignment in the Let's Talk Excel programme. All cleaning, analysis and visuals were done independently by Dorcas.
=IF(you_have_data, "let's look at it together", "say hello anyway")
Whether it's a role, a messy spreadsheet or a question about one of the case studies, messages come straight to my inbox.
Open to data analyst and BI work: full-time, contract or freelance, remote or on-site